Contrived Clueless Command Line Data Crunching
Remember the assignment Command Line Earthquake Magnitude Frequency Count? Here’s that same exercise, repeated 12 times across 12 different datasets.
I won’t even bother to explain the context or provenance of the datasets. But if you like context, I include links to where the landing pages of the data that offer some documentation. Whatever helps you get from the starting point of the raw data to the expected output.
These exercises are called “contrived” because I don’t assume that you can do “real” programming yet – because we haven’t really learned programming – and are limited to the “crude” but powerful command-line tools of ack, sort, etc. When we get into programming with Python, knowing the limitations of the powerful command-line tools will help you appreciate the additional flexibility and power that “real” programming provides.
This homework is not just more practice, but a way to give you first-hand insight into how the hard work of programming is to get something to work just once.
But once you’ve got something working, applying that solution to 10 or even 100,000 similar problems requires superficial effort. Even if the previous assignment took you 4 hours, that does not mean this one will take you 48 hours.
Understanding the exponential effect of programming is key to understanding how to apply it to journalism and to do scalable work in journalism.
- Rubric
- Delivery format
- The Work
- 1. NASA annual global temperature averages
- 2. NASA annual global greenhouse gas measurements
- 3. San Francisco evictions by year due to “Breach” or “Nuisance”
- 4. Marijuana Pending Applications in the City of Denver
- 5. Menlo Park Building Permit Applications valued at $100 million+
- 6. Benford’s Law analysis of 2004 U.S. presidential vote tallies by county
- 7. Number, by race, of 2016 fatal police shootings in which the deceased was unarmed
- 8. Number, by race, of 2016 fatal police encounters in which the deceased was unarmed
- 9. Top 20 highest-paid city employees in Palo Alto, East Palo Alto, and Menlo Park for 2015
- 10. Fetch the Stanford Daily headlines
- 11. State of Texas executions by year
- 12. State of Florida executions by race of the executed
Rubric
- Due date:
- 1:00 PM, 2017-01-24
| Points | Metric |
|---|---|
| 1 | Having a correct subject headline of compciv-2017::your_sunet_id::cccldc |
| 1 | Your email contains 12 attachments, named 1.sh through 12.sh for each of the exercises |
| 10 | Your scripts produce the expected output |
Delivery format
Send an email to dun@stanford.edu with the subject:
compciv-2017::your_sunet_id::cccldc
Where your_sunet_id is your Stanford student ID, all-lowercase.
The email should include 12 attachments, e.g. 1.sh for exercise 1, and so forth.
The body of the email should read:
please make it stop
Our dev server
It’s highly recommended that you use the dev.thrill.haus server that I’ve set up (and, hopefully, emailed you with a login and password). It has the exact software needed to do the exercises, including csvkit and ack.
The McClatchy Lab computers will work. The Stanford shared computing may or may not – it’s not even worth trying.
If you do the homework on dev.thrill.haus, move your answers to the public folder. Every file in that directory is accessible to the web at:
http://dev.thrill.haus/your_username/thatfilename.sh
I highly recommend using mutt to email the files to me. The problem, of course, is that to use mutt, you need to run mutt from cardinal.stanford.edu. No problem:
Do your work on
dev.thrill.hausPut all your answer files in your
public/directory.Log in to
cardinal.stanford.eduDownload the files from
dev.thrill.hausonto cardinal usingcurl:$ curl http://dev.thrill.haus/your_username/1.sh > 1.sh
Attach those files as a batch and send them to me with
mutt:$ echo 'please make it stop' \ | mutt -s 'compciv-2017::your_sunet_id::cccldc' \ -a 1.sh 2.sh 3.sh 4.sh 5.sh 6.sh 7.sh 8.sh 9.sh 10.sh \ 11.sh 12.sh \ -- dun@stanford.edu
The Work
The only tools you’ll need for this assignment:
And, where mentioned:
1. NASA annual global temperature averages
- Prompt:
- The script
1.shshould read the raw data text file of NASA temperature measurements and transform it into a two-column CSV, with the year and annual mean. - Landing page:
- https://data.giss.nasa.gov/modelforce/
- Direct download URL:
- https://data.giss.nasa.gov/gistemp/graphs_v3/Fig.A.txt
- Mirror URL:
- http://stash.compciv.org/2017/nasa-gistemp.txt
Expected output
When I execute your script like this:
$ bash 1.sh | head -n 5
I expect to see:
year,avgtemp
1880,-0.55
1881,-0.55
1882,-0.46
1883,-0.53
When I execute your script like this:
$ bash 1.sh | csvsort -c avgtemp -r | head -n 5
I expect to see:
year,avgtemp
2016,1.23
2015,0.95
2010,0.9
2005,0.86
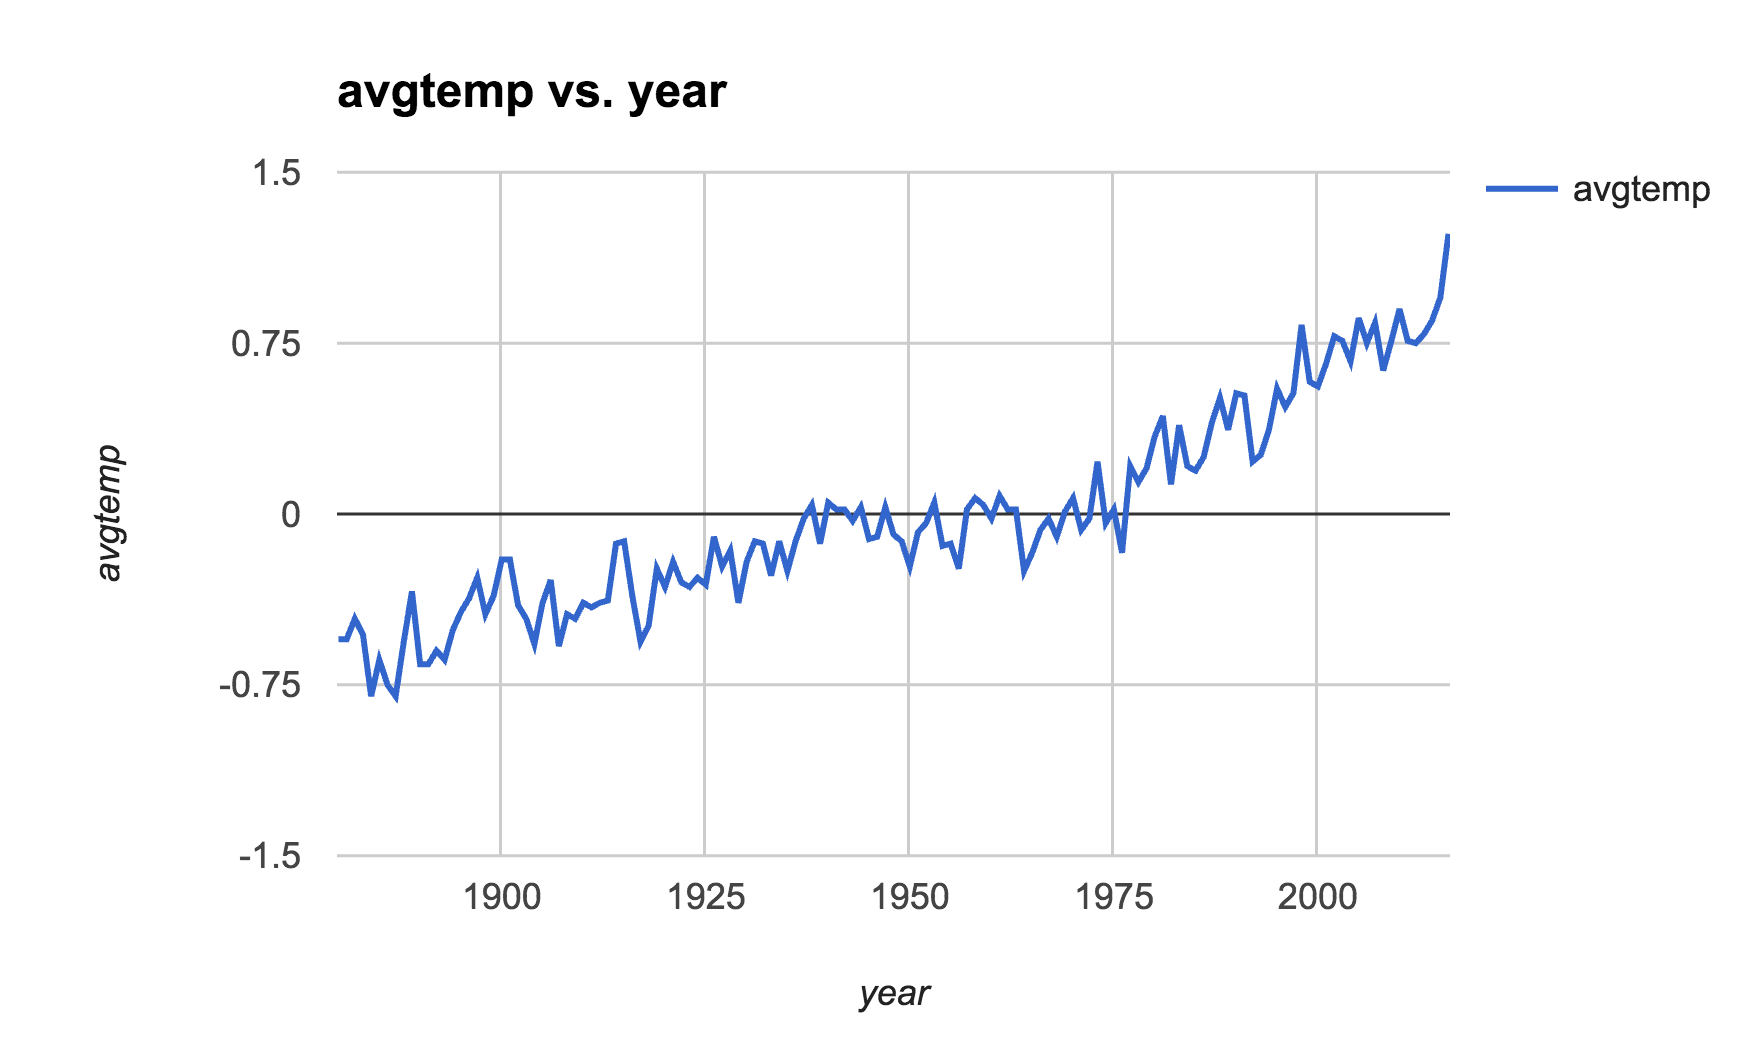
If you save the output of your 1.sh script to a CSV file and open it in a modern spreadsheet (such as Google Sheets, and not the piece of crap that is Excel 2011), the result will look like this:
Hints
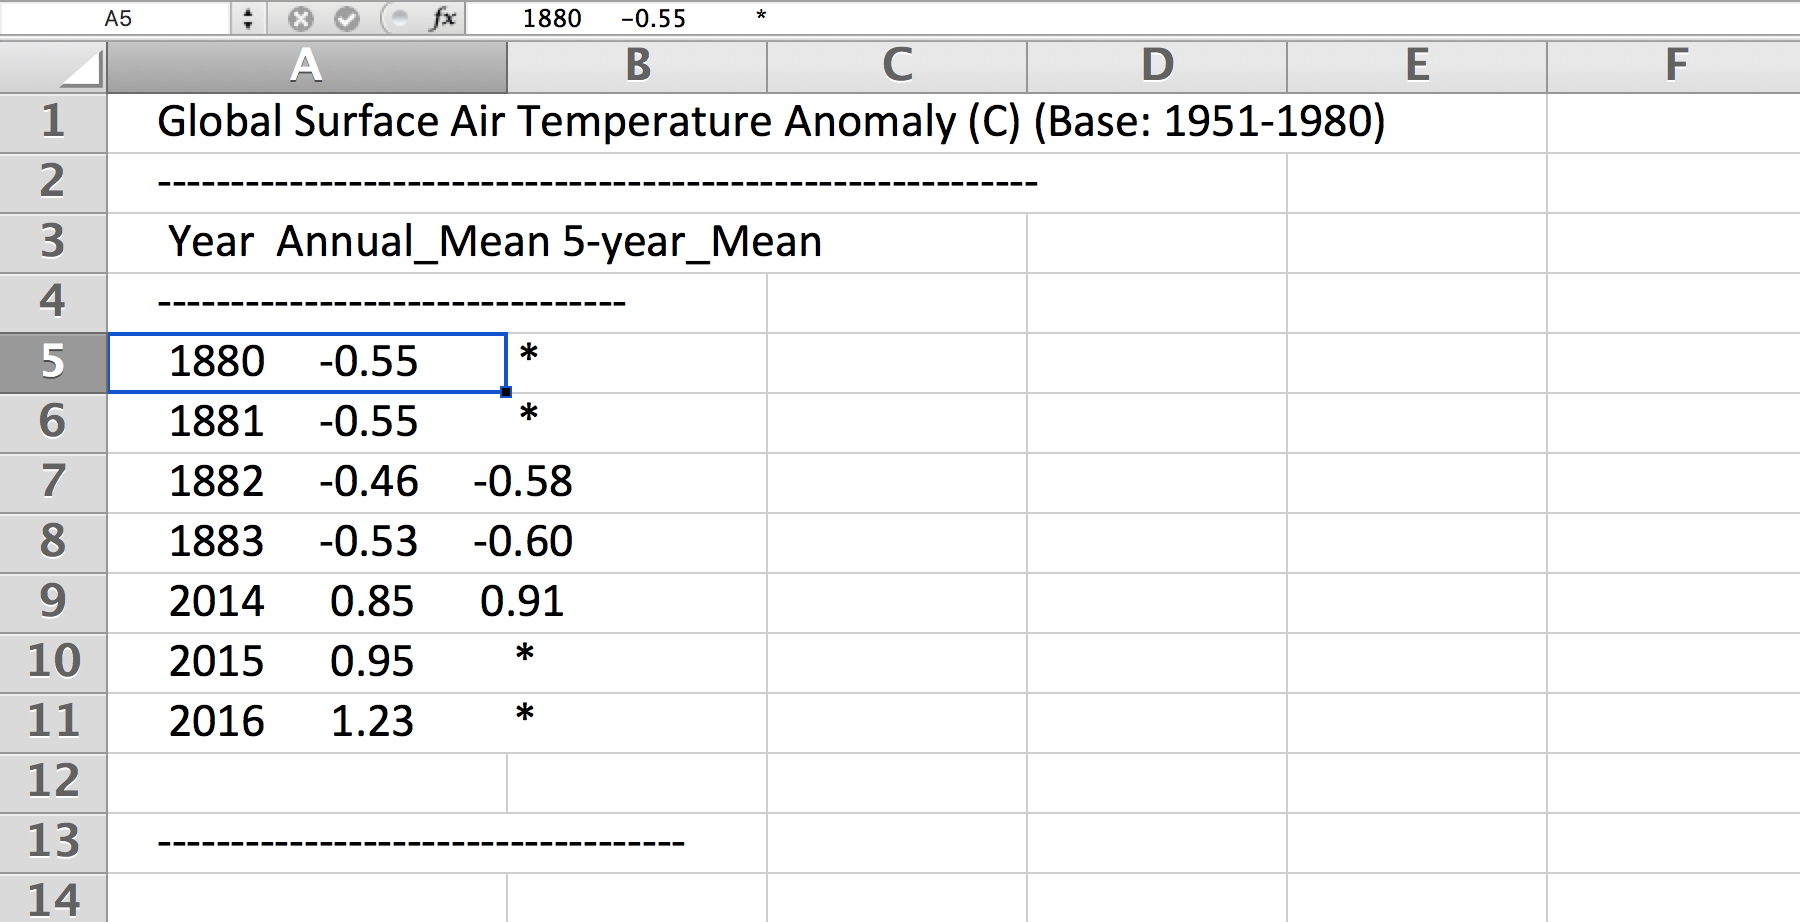
The NASA data is unstructured text that looks like structured data.
Here is what the first 8 lines and the bottom 5 lines look like:
http://stash.compciv.org/2017/nasa-gistemp-sample.txt
Global Surface Air Temperature Anomaly (C) (Base: 1951-1980)
------------------------------------------------------------
 Year  Annual_Mean 5-year_Mean
--------------------------------
 1880     -0.55         *
 1881     -0.55         *
 1882     -0.46     -0.58
 1883     -0.53     -0.60
 2014      0.85      0.91
 2015      0.95         *
 2016      1.23         *

------------------------------------
We want the first two columns (Year and Annual_Mean) and none of the boilerplate, such as the headers or the ---------- lines.
As further evidence that this isn’t structured data, paste the above text into any spreadsheet:
We have to use a regex to bend it to our desired format. We want the Year and the Annual_Mean. What’s that as a regex pattern?
- A 4 digit number (the year)
- Followed by one-or-more spaces
- Followed by an optional negative sign (remember when the Earth’s temperature dropped annually? I don’t)
- Followed by one or more digits
- Followed by a literal dot character
- Followed by one or more digits
Here’s one way to do that pattern; finish it up with a capturing group and the use of ack with --output:
$ curl -s http://stash.compciv.org/2017/nasa-gistemp.txt \
    | ack -o '\d{4} +-?\d+\.\d+'
Useful regular expression techniques:
- optionality with
?http://www.regular-expressions.info/alternation.html - limited repetition with
{n}http://www.regular-expressions.info/repeat.html - one-or-more matching with
+http://www.regular-expressions.info/repeat.html - Capturing groups with
( )http://www.regular-expressions.info/brackets.html
Because the data file is 100+ lines, you may want to test against this 13-line version just so it’s easier to predict what you want to see as the answer:
http://stash.compciv.org/2017/nasa-gistemp-sample.txt
To see an example of how I iteratively create the regex pattern, step-by-step, check out this animated demo:
https://asciinema.org/a/100135
Remember your UP key!
2. NASA annual global greenhouse gas measurements
- Prompt:
- The script
2.shshould read the NASA file of unstructured data and output a two-column CSV of annual CO2 measurements by year and parts per million. Collect only the data under theObservationstable, and not theFuture Scenarios. - Landing page:
- https://data.giss.nasa.gov/modelforce/
- Direct download URL:
- https://data.giss.nasa.gov/modelforce/ghgases/Fig1A.ext.txt
- Mirror URL:
- http://stash.compciv.org/2017/nasa-ghgases.txt
Expected output
When I execute your script like this:
$ bash 2.sh | head -n 5
I expect to see:
year,co2ppm
1850,285.2
1851,285.1
1852,285.0
1853,285.0
When I execute your script like this:
$ bash 2.sh | csvsort -r -c 2 | head -n 5
I expect to see:
year,co2ppm
2011,391.15
2010,389.21
2009,386.95
2008,385.46
Hints
This is similar to the previous problem of unstructured text data from NASA. But you have to write a pattern that matches only the numbers in the top half of a file. Easiest way to do that: just get the first 57 lines of the file, and you don’t have to worry about the “Future Scenarios” data at all.
This is a good use for the head program:
$ curl -s http://stash.compciv.org/2017/nasa-ghgases.txt \
    | head -n 57
3. San Francisco evictions by year due to “Breach” or “Nuisance”
- Landing page:
- https://data.sfgov.org/Housing-and-Buildings/Eviction-Notices/5cei-gny5/data
- Direct download URL:
- http://stash.compciv.org/2017/sf-evictions.csv
Expected output
When I execute your script like this:
$ bash 3.sh
I expect to see:
year,evictions
1997,582
1998,549
1999,543
2000,625
2001,627
2002,486
2003,559
2004,438
2005,589
2006,550
2007,663
2008,670
2009,640
2010,717
2011,748
2012,752
2013,910
2014,1073
2015,981
2016,715
4. Marijuana Pending Applications in the City of Denver
- Prompt:
- Do a group count of the currently pending applications by license type.
- Landing page:
- https://www.denvergov.org/opendata/dataset/city-and-county-of-denver-marijuana-pending-applications
- Direct download URL:
- http://stash.compciv.org/2017/denver_marijuana_pending_applications.csv
Expected output
When I execute your script like this:
$ bash 4.sh
I expect to see:
 6 Medical Marijuana Center
19 Retail Marijuana Store
5. Menlo Park Building Permit Applications valued at $100 million+
- Prompt:
- Print the data row for each Menlo Park building permit application valued at $100M+
- Landing page:
- https://data.menlopark.org/Building-and-Planning/Building-Permit-Applications/aac9-hxa9/data
- Direct download URL:
- http://stash.compciv.org/2017/menlo-park-building-permits.csv
Expected output
When I execute your script like this:
$ bash 5.sh
I expect to see:
Date Received,Date Issued,# of Days,Permit #,Work Type,Use Type,Project Description,Project Valuation,Permit Fee,Location 1
08/23/2016 12:00:00 AM,,,BLD2016-01295,NEW,COM,"MPK21- Structural steel and foundations, including underground utilities for building pad",$118000000.00,$878258.81,"1 FACEBOOK WAY
Menlo Park, CA 94025
(37.432111, -122.219302)"
Hints
This is a situation where ack, or any other line-by-line pattern matcher won’t work. CSV data can have multiple lines if a column has newline characters in it, and ack only works on one line at a time.
The csvkit suite of tools has a tool named csvgrep for exactly this occasion. Use the -c flag to specify which column you want to match against, and -r to specify the regex pattern.
“$100,000,000” is a nine-digit number:
$ curl -s http://stash.compciv.org/2017/menlo-park-building-permits.csv \
    | csvgrep -c 8 -r '\d{9,}'
Warning
A note for Stanford students
I think the csvgrep on the McClatchy hall computers is out of date, and the above example may not work. Test it out on the dev.thrill.haus server.
6. Benford’s Law analysis of 2004 U.S. presidential vote tallies by county
- Prompt:
- See if the county vote totals of the 2004 presidential elections match the predictions of Benford’s Law.
- Page about Benford’s Law:
- http://www.journalofaccountancy.com/issues/1999/may/nigrini.html
- Landing/info page for the data:
- https://github.com/helloworlddata/us-presidential-election-county-results
- Direct download URL:
- http://stash.compciv.org/2017/us-presidential-election-county-results.csv
Expected output
When I execute your script like this:
$ bash 6.sh
I expect to see:
first_digit,count
1,959
2,503
3,362
4,322
5,259
6,214
7,196
8,179
9,159
Hints
Start off by using csvcut to trim the data to the only columns you need – year and vote total:
$ curl -s http://stash.compciv.org/2017/us-presidential-election-county-results.csv \
    | csvcut -c year,vote_total \
    | ack '^2004'
Benford’s Law states that given a set of naturally-incrementing numbers, we should expect 30% of the first-digits of the numbers to be 1. Use a regex to extract the leading character of every number-string.
7. Number, by race, of 2016 fatal police shootings in which the deceased was unarmed
- Prompt:
- Filter the Washington Post police shootings data for 2016 incidents in which the person was unarmed, and do a group count by race.
- Landing page:
- https://github.com/washingtonpost/data-police-shootings
- Direct download URL:
- http://stash.compciv.org/2017/wapo-police-shootings.csv
Expected output
When I execute your script like this:
$ bash 7.sh
I expect to see:
22 W
17 B
 8 H
 1 N
Hints
Note that I don’t require printing the output as CSV (you probably have memorized the steps to do so by now).
The police shootings data, which the Washington Post collected by hand, was the backbone of their 2015 Pulitzer Award: http://www.pulitzer.org/prize-winners-by-year/2016
Related reading:
Inside the Washington Post’s police shootings database: An oral history
8. Number, by race, of 2016 fatal police encounters in which the deceased was unarmed
- Prompt:
- Filter the Guardian’s fatal encounter data for 2016 incidents in which the person was unarmed, and do a group count by race.
- Landing page:
- https://www.theguardian.com/us-news/ng-interactive/2015/jun/01/about-the-counted
- Direct download URL:
- http://stash.compciv.org/2017/the-counted-2015-2016.csv
Expected output
When I execute your script like this:
$ bash 8.sh
I expect to see:
95 White
42 Black
27 Hispanic/Latino
 2 Native American
 1 Unknown
 1 Asian/Pacific Islander
 1 Arab-American
Hints
The Guardian is ostensibly keeping track of the same thing as the Washington Post, but the numbers are far different. Consider the difference in scope of “fatal encounters” that the two organizations use. Also, note that both have different ways of labeling race/ethnicity – in every real-world dataset, data collectors will have varying opinions on the methodology.
Related reading:
9. Top 20 highest-paid city employees in Palo Alto, East Palo Alto, and Menlo Park for 2015
- Prompt:
- Combine the 2015 salary data for the 3 cities (using csvstack) and list the top 20 employees by total pay + benefits. Trim the data to show only the employee name, job title, total pay + benefits, and agency (i.e. city)
- Landing page:
- http://transparentcalifornia.com/
- Direct download URLS:
Expected output
When I execute your script like this:
$ bash 9.sh
I expect to see:
Employee Name,Job Title,Total Pay & Benefits,Agency
James Keene,City Manager,450501.71,Palo Alto
Molly Stump,City Attorney,380924.03,Palo Alto
Dennis Burns,Police Chief-Adv,360317.08,Palo Alto
Robert Beacom,Assistant Police Chief,349961.47,Palo Alto
Everardo Perez,Director Administrative S,344541.67,Palo Alto
Valerie Fong,Director Utilities,343839.22,Palo Alto
Adrienne Moore,Police Sgt/Adv,321924.54,Palo Alto
Ron Watson,Police Captain-Adv,312873.40,Palo Alto
Kathryn Shen,Director Human Resources/,310738.43,Palo Alto
Eric Nickel,Fire Chief,304790.74,Palo Alto
Hillary Gitelman,Director Planning/Communi,304181.87,Palo Alto
James Sartor,Director Public Works/Cit,302483.91,Palo Alto
Patricia Lum,Police Lieut-Adv,301000.70,Palo Alto
Cara Silver,Senior Assistant City Att,293843.13,Palo Alto
Jonathan Reichental,Director Information Tech,293708.03,Palo Alto
Peter Pirnejad,Development Services Dire,290858.88,Palo Alto
Robert Bonilla,Police Lieut-Adv,290334.58,Palo Alto
Jane Ratchye,Asst Dir Ut/Res Mgmt,290286.68,Palo Alto
Alexander D McIntyre,City Manager,288720.81,Menlo Park
Hints
You’ll want to first download the 3 data files. The -O flag of curl can be used when you’re too lazy to name the destination file:
curl -s -O http://stash.compciv.org/2017/salaries-palo-alto-2015.csv
curl -s -O http://stash.compciv.org/2017/salaries-east-palo-alto-2015.csv
curl -s -O http://stash.compciv.org/2017/salaries-menlo-park-2015.csv
Now, combine them into one. This is the kind of thing cat seems built for. Unfortunately, all 3 files have their own headers, which means that those headers will all be thrown into the combined data.
So this is why csvstack was created:
$ csvstack salaries-palo-alto-2015.csv salaries-east-palo-alto-2015.csv salaries-menlo-park-2015.csv
In the Bash shell, the * is interpreted as a wildcard for matching filenames. So instead of writing out all 3 file names, try this:
$ csvstack salaries-*.csv
Remember that the standard sort tool sorts lines, starting with the first character. We don’t want that here. We want a reverse-sort of the column corresponding to “Total Pay and Benefits”.
Use csvsort, which allows us to sort this data like the structured data that it is (i.e. by column):
$ csvstack salaries-*.csv | csvsort -r -c 8
10. Fetch the Stanford Daily headlines
- Prompt:
- Like many news sites, the Stanford Daily has a RSS feed. Extract the text between the
<title>tags as a quick and dirty way of extracting the headlines. - Official feed:
- http://www.stanforddaily.com/feed/
- My copy of the feed:
- http://stash.compciv.org/2017/stanforddaily-feed.xml
Expected output
When I execute your script like this:
$ bash 10.sh | head -n 5
I expect to see:
Stanford DailyStanford Daily
Kim K is back, and so are we
On solo travel
Taking the lid off CAPS
To burn and to love
Hints
XML, like HTML, is just text, and thus we can use regexes to match patterns. Each story in the Daily’s feed is wrapped in <item> tags. And each “item” has several attributes, including “title”, which is wrapped in <title> tags:
<item>
        <title>Kim K is back, and so are we</title>
        <link>http://www.stanforddaily.com/2017/01/19/kimkisbackandsoarewe/</link>
In the expected output, that Stanford DailyStanford Daily is supposed to be there, and is meant as a subtle hint to how regex alone is not enough to parse XML or HTML (or any data format). Hence, why we learn “real” programming.
11. State of Texas executions by year
- Prompt:
- Download the Texas Executed Offenders list and use a regex to match the necessary text for doing a group count of executions by year.
- Direct download URL:
- http://www.tdcj.state.tx.us/death_row/dr_executed_offenders.html
Expected output
When I execute your script like this:
$ bash 11.sh | head -n 5
I expect to see:
year,executions
1982,1
1984,3
1985,6
1986,10
When I execute your script like this:
$ bash 11.sh | tail -n 5
I expect to see:
2012,15
2013,16
2014,10
2015,12
2016,7
12. State of Florida executions by race of the executed
- Direct download URL:
- http://www.dc.state.fl.us/oth/deathrow/execlist.html
Expected output
When I execute your script like this:
$ bash 12.sh
I expect to see:
race,executions
W,60
B,29
O,3
H,1